The Bottleneck
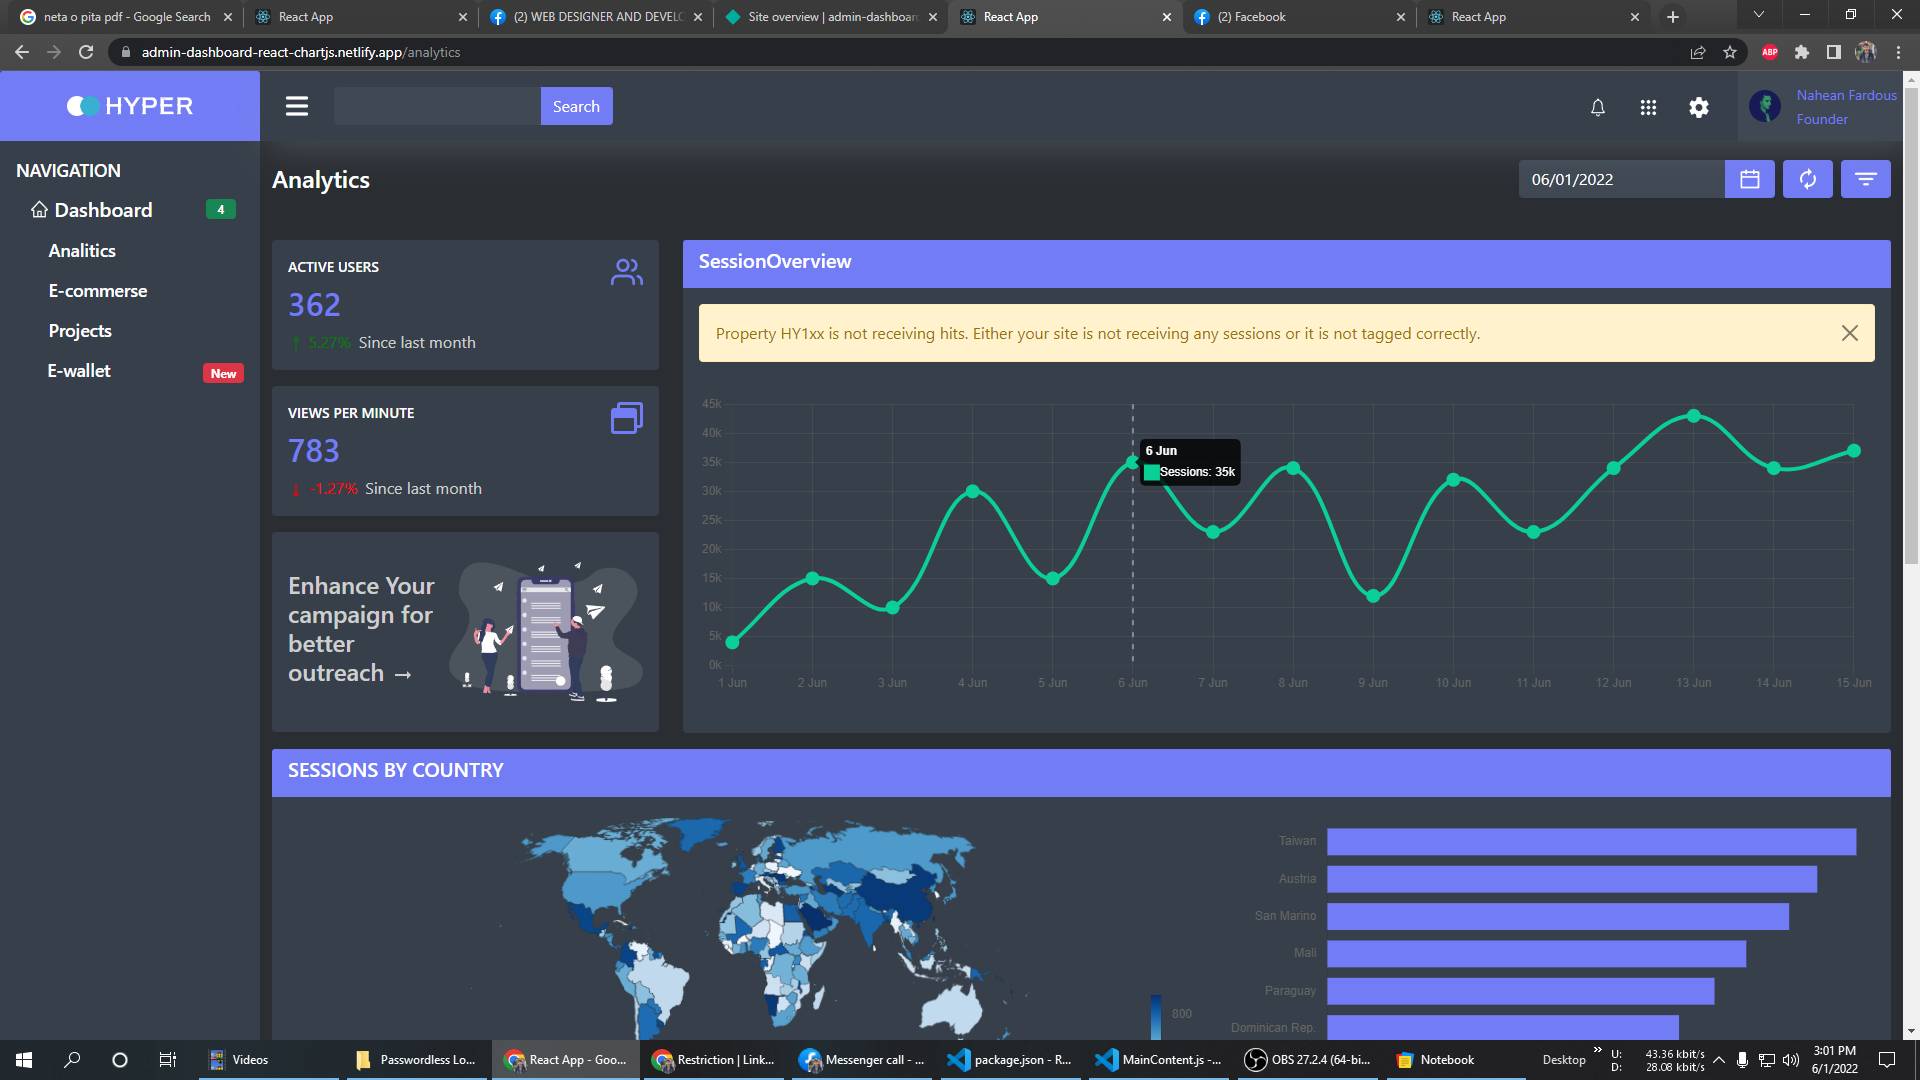
The client's primary analytics dashboard contained 12 charts. Updating a single global date filter caused all 12 charts to unmount and remount, freezing the browser for nearly 2 seconds.
The Fix
- Context Splitting: Separated the global state into
UI_ContextandData_Context. - useMemo & React.memo: Wrapped expensive chart components to ensure they only re-rendered when their specific data slice changed.
- Web Workers: Offloaded the heavy JSON data parsing to a background worker.
The Outcome
Achieved a buttery-smooth 60fps interaction rate, even when processing arrays with 50,000+ data points.